Monitored services
A Harness monitored service, within the framework of the Harness platform, is a combination of a Harness service and an environment. This logical unit represents various types of workloads, like microservices, that can be monitored. Environments, on the other hand, represent the deployment targets, such as QA, production, or any other environment where the workload will be deployed.
A Harness monitored service functions as a unified logical entity across three modules: Continuous Delivery (CD), Service Reliability Management (SRM), and Continuous Error Tracking (CET). A monitored service can be created in the following ways within Harness:
- at the Project level
- within the CD module
- inside the SRM module
- within the CET module
Create a monitored service at project level
Currently, this feature is behind the feature flag SRM_COMMON_MONITORED_SERVICE. Contact Harness Support to enable the feature.
When you create a monitored service at the Project Level, it becomes accessible across all three modules: CD, SRM, and CET.
To create a monitored service at the project level:
-
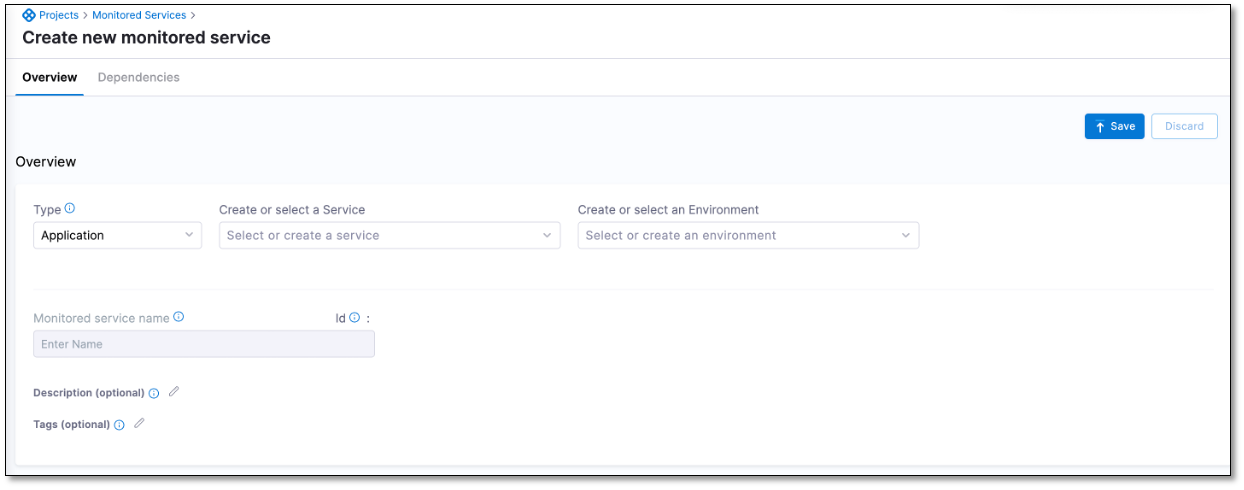
In Harness, select Project > Monitored Services > + New Monitored Service.
The Create new monitored service dialog appears.
DocImage
-
In the Overview section, enter the following information:
-
Type: Select the type of service that you want to monitor. You can choose either Application or Environment.
-
Create or select a Service: You can either select an available service from the drop-down list or create a new one. To create a new service, select + Add New, enter a name for the service, an optional description, and a tag, and then select Save.
-
Create or select an Environment: You can either select an available environment from the drop-down list or create a new one. To create a new environment:
-
Select + Add New.
-
In the New Environment dialog, do the following:
-
Enter a name for the service, an optional description, and a tag.
-
Select an environment type. You can choose Production or Non-Production.
-
Configure the environment overrides. You can define what will be overridden when a service is deployed in this environment.
-
-
Select Save.
-
-
-
Enter a name for the monitored service, an optional description, and a tag.
-
Select Save. The monitored service is created and appears in the list of existing monitored services.
View the list of monitored services at project level
To view the list of monitored services:
-
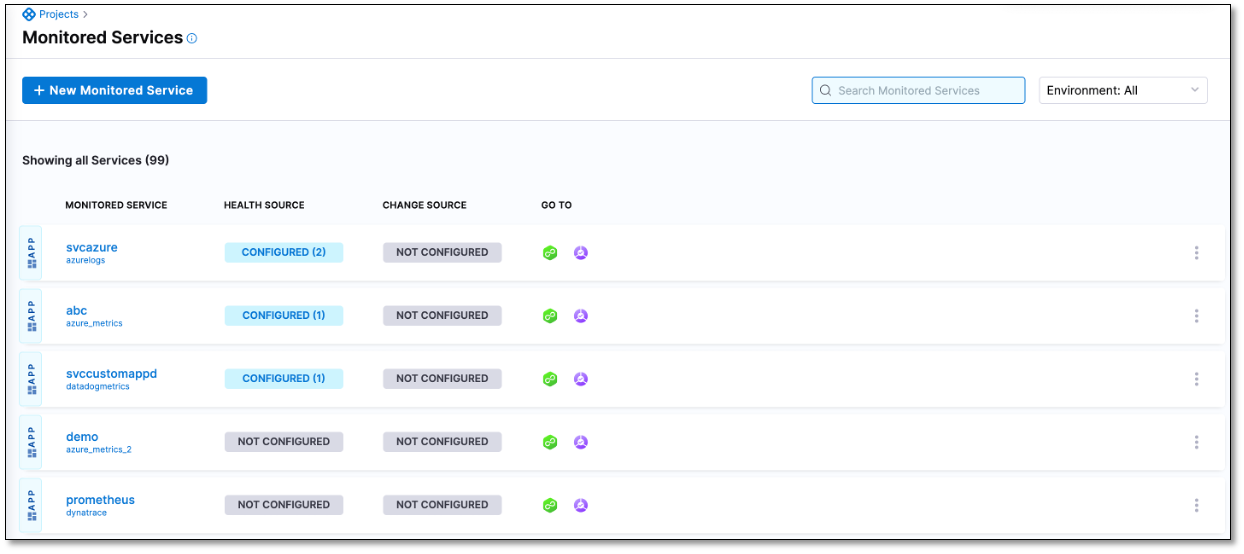
In Harness, select Project > Monitored Services.
A comprehensive list of all monitored services is displayed. The list includes the names of monitored services along with a count of health sources configured for each service.

View monitored service details
DocImage You can view detailed information about a monitored service by clicking directly on the monitored service's name in the list.
View monitored service details from a specific module
To view the monitored service details within a specific module:
-
Locate the monitored service you're interested in within the list.
-
In the Go To column, you'll notice module icons corresponding to various modules such as Continuous Delivery, Service Reliability Management, and Continuous Error Tracking.
-
Select the module icon that corresponds to the Harness module from which you want to view the monitored service details. You will be automatically navigated to that specific module. The monitored service details page with the information relevant to that specific module is displayed.
For example, if you want to view the monitored service details from the SRM module, select the Service Reliability Management icon. You will be automatically navigated to the SRM module, and the monitored service details page with information specific to that module will be displayed.
Monitored service within the Continuous Delivery (CD) module
Currently, this feature is behind the feature flag SRM_COMMON_MONITORED_SERVICE. Contact Harness Support to enable the feature.
In the CD module, when you're using the Verify Step for Continuous Verification (CV), the system automatically generates a monitored service. This happens by combining the names of the service and the environment. This monitored service is readily available within the CD module.
To view the monitored service list from the CD module:
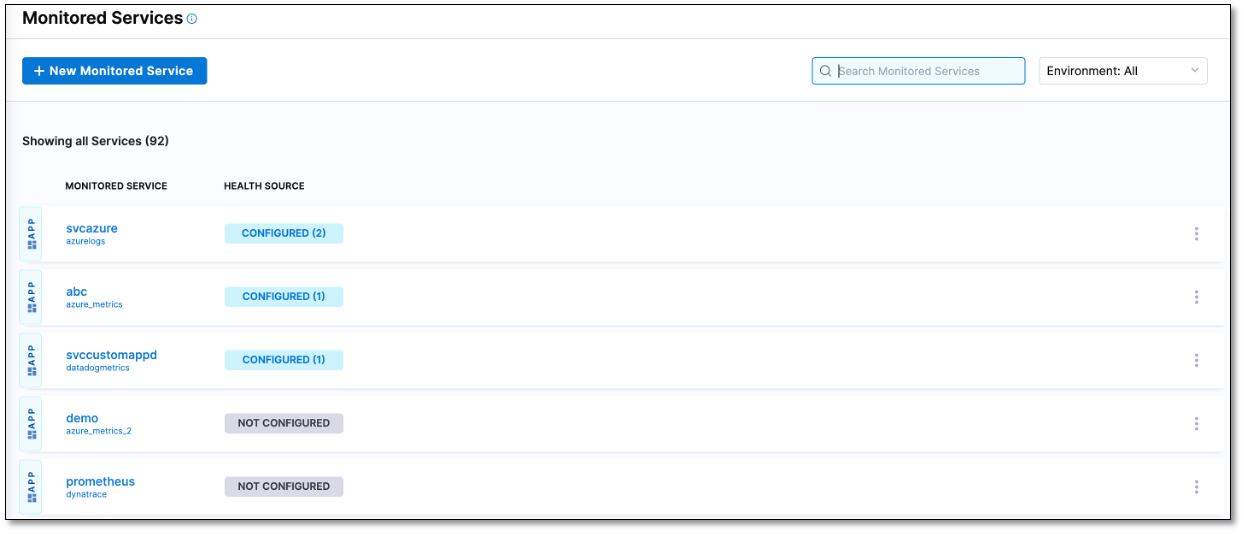
- In Harness, select Deployment > Monitored Services.
A list of monitored services is displayed. The list also displays the number of health sources configured for each monitored service.

Monitored service within the Service Reliability Management (SRM) module
You can view and create monitored services from the SRM module.
To view the monitored service list from the SRM module:
-
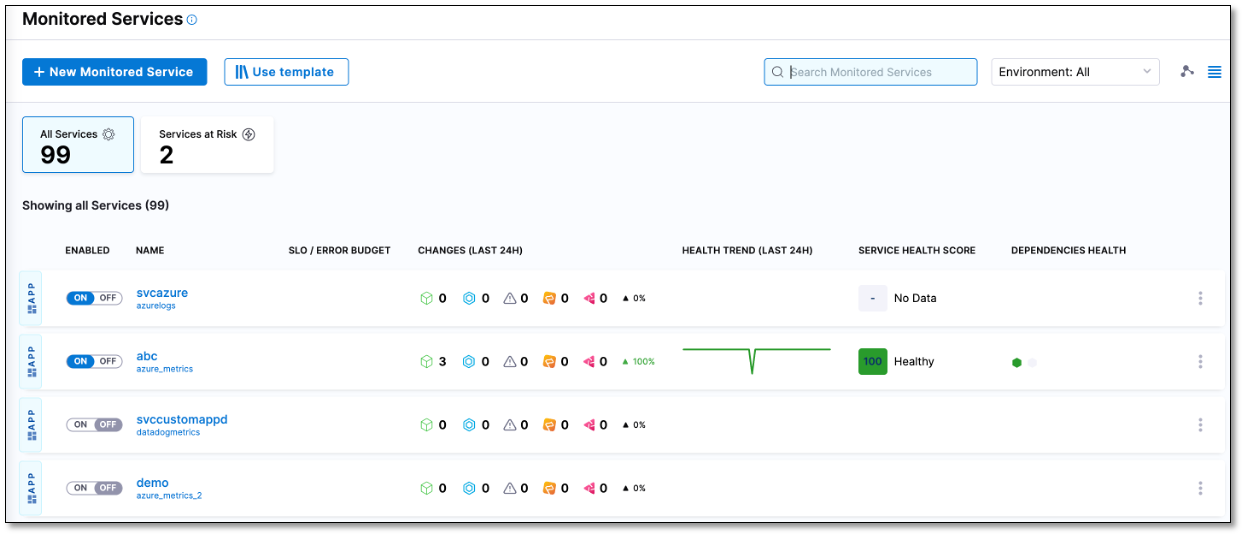
In Harness, select Service Reliability > Monitored Services. DocImage A list of monitored services is displayed. The list provides information such as the service's enablement status, name, SLO and error budget details, recent changes and health trends in the past 24 hours, health score, and health status of associated dependencies.

You can create a monitored service directly from the SRM module.
Monitored service within the Continuous Error Tracking (CET) module
Currently, this feature is behind the feature flag CET_PLATFORM_MONITORED_SERVICE. Contact Harness Support to enable the feature.
You DocImage and create monitored services from the CET module.
To view the monitored service list from the CET module:
-
In Harness, select Error Tracking > Monitored Services.
A list of monitored services is displayed. The list includes details such as the service name and indicates whether the Error Tracking Agent and notifications are configured.

You can create a monitored service directly from the CET module. DocImage