Detect cloud cost anomalies
Changes in infrastructure, the addition of new services, or inefficient utilization of underlying resources can result in variations in expenses. The objective of the Harness Cloud Cost Management (CCM) anomaly detection feature is to detect instances of abnormally high costs and promptly notify users of these occurrences.
Harness CCM detects cost anomalies for your Kubernetes clusters and cloud accounts. Cloud cost anomaly detection can be used as a tool to keep cloud costs under control. It also provides alerting capabilities through email and Slack to notify stakeholders when an anomaly is detected.
Currently, CCM detects anomalies for the following:
Clusters: Kubernetes clusters, namespaces, workloads and services.
- AWS: Accounts, services and usage types
- GCP: Projects, products and SKUs
- Azure: Subscription IDs, resource groups and meter categories
- For the K8s clusters, CCM obtains the necessary data from the TimeScale database.
- For cloud platforms like AWS, GCP, and Azure, the required data is gathered from BigQuery.
What is Cost Anomaly Detection?
Cost anomaly detection points you to what you should be paying attention to keep your cloud costs under control. Whenever there is a significant increase in your cloud cost, an alert is triggered. This helps to keep track of potential waste and unexpected charges. It also keeps an account of the recurring events (seasonalities) that happen on a daily, weekly, or monthly basis.
CCM cost anomalies compare the previous cloud cost spends with the current spending to detect cost anomalies. If the actual cost incurred deviates substantially from the expected cost, then it can be a potential cost anomaly.
How Does Cost Anomaly Detection Work?
CCM uses statistical anomaly detection techniques and Forecasting at scale to determine cost anomalies. These methods can detect various types of anomalies, such as a one-time cost spike, gradual, or consistent cost increases.
CCM analyzes 15 to 60 days of data to predict the cost. If the predicted cost and the actual cost incurred deviate beyond the fixed parameters (as described in the anomaly detection techniques), it is marked as a cost anomaly.
For example, you run a compute-intensive job that gets kicked off every Monday morning. The algorithm picks up on the pattern and updates its model. Based on these learnings predictions are made for what might happen in the future. Anything that doesn't align with these predictions is a potential anomaly.
The anomaly detection techniques are run every 24 hours and the alert is triggered for any anomaly that is detected.
Anomaly detection workflow
- Retrieve the time series data
Retrieve data from the Timescale DB by using the batch processing services. Then the required data is extracted using a reader. This extracted data is then directed to the statistical method for further analysis.
- Anomaly detection models
After subjecting the data to the first model, it is determined whether anomalies occurred on specific days. If no anomalies are detected, the data is dismissed. However, in case an anomaly is identified, the process moves forward to the next model for further analysis.
- Removing Duplicates
After the data has undergone processing through the second model, if no anomalies are identified, any previously detected anomalies from the first model are disregarded. On the other hand, if an anomaly is detected through the second model, that specific anomaly is retained and subsequently the process of identifying and eliminating nearby anomalies as well as parent-child anomalies is initiated.
- Duplicate anomalies: Anomalies in lower level entities show up in higher level entities. For example, a lower level entity is a namespace and a higher level entity is a cluster. The cost of a cluster is the sum of the costs of all the namespaces that reside in it. If, on a certain day, anomalies are detected in both
Cluster1andNamespace1, the anomaly related toNamespace1is retained. - NearBy Anomalies: Consider a situation where there is a sudden unusual increase in expenses on a specific day. This spike in cost might also show up in the following days. This might trigger multiple anomaly alerts which is unnecessary. The goal is to notify the users just once and avoid sending multiple alerts.
For example, CCM detects an unusual event on a certain day (Nth day). CCM checks if the same kind of unusual event occurred in the date range N-5 to N-1. To explain this further, if the Nth day is 26th August, N-5 to N-1 would be 21st to 25th August.
If CCM finds that this specific event didn't happen in that date range, it is considered as a new unusual event. A record of it is stored and an the user is notified.
If CCM finds that this event did happen in that date range, the cost of the Nth day is compared to the highest cost within that date range.
- If the cost on the Nth day is more than 1.5 times the highest cost in that range, it means something even more unusual is going on than what the user was previously notified about in the [N-5, N-1] range. So, an alert is sent again.
- If the cost on the Nth day is less than or equal to 1.5 times the highest cost in that range, it means the unusual event from [N-5, N-1] range is still affecting the cost on the Nth day. In this case, no alert is triggered.
Model 1 detection technique
In this approach, CCM uses a dataset spanning X days to calculate both the mean and the standard deviation of the data. Subsequently, the following assessment is applied to the data from the (X+1)th day:
If the absolute difference between the data on the (X+1)th day and the mean is greater than three times the standard deviation, that is |(Data on (X+1)'th day) - mean | > 3 * S.D
If this condition is met, it is classified as an anomaly.
Mean = (∑xi / n): Sum of all data points (Σxi) divided by the total number of data points (n). Standard Deviation = ∑(Xi - mean)^2/n: Square root of the sum of the squared differences between each data point and the mean divided by the total number of data points (n).
Threshold filtering
In most prediction methods, thresholds play a pivotal role by involving two values—the actual observed value and its corresponding predicted value. The core objective is to evaluate these values and establish the presence of anomalies. However, straightforward comparisons like (actual > predicted) can frequently result in false anomalies. To address this challenge, thresholds act as a filtering mechanism. The following are the various threshold filtering methods:
Absolute Difference Method
This method takes the absolute difference between the two variables in the dataset. CCM considers the actual and predicted cost as two variables. If the difference between the actual and predicted costs exceeds $75, then the cost is considered a potential anomaly.
Actual cost - Predicted Cost > $75
For example, the actual cost of your cloud resource is $120 and the predicted cost was $25.
The difference between the actual and predicted is $120 - $21 = $99 which is greater than the $75 fixed amount.
Hence, it is a potential cost anomaly.
Relative Method
In this method, if the actual cost is a minimum of 1.25 times higher than the predicted cost, then it is a potential cost anomaly.
Actual Cost / Predicted Cost >= 1.25X
For example, the difference between the actual and predicted is 120 / 21 = 5.71 which is higher than the fixed 1.25x value.
Hence, it is a potential cost anomaly.
Probability Method
In this method, the algorithm uses a probability of 99% within a range to predict the cost.
For example, the actual cost is predicted to be in the range of $10–$14 with a 99% probability. Anything that deviates from this range is a potential cost anomaly.
Model 2 detection technique
This is a time series forecasting model designed to handle the challenges often encountered in time series data, such as seasonality, holidays, and other recurring patterns. The model combines both additive and multiplicative elements to effectively capture the diverse patterns present in the data.
Data requirement for anomaly prediction
The time duration considered for each entity ranges from a minimum of 14 days to a maximum of 41 days, with these values currently being set as the boundaries. For the algorithms that analyze these time series data, a minimum of 14 days of data is needed to effectively grasp usage patterns and make predictions based on those patterns. However, a problem arises when new services or dimensions are added to the system. These newly introduced elements don't yet have the required 14 days worth of data for analysis. To address this challenge, CCM extends the data timeline by adding zeros to fill the gaps, ensuring that a continuous 2-week period of data is available. With this extended data, the algorithms can then accurately predict anomalies even for the new entities until a full 14 days of real data is gathered.
Filtering out anomalies less than $100
-
Kubernetes Clusters: For K8s clusters, CCM doesn't exclude anomalies based on a minimum cost threshold. This means that anomalies, regardless of their cost value, are not automatically filtered out.
-
Clouds (AWS, GCP, Azure): For cloud-related anomalies, CCM filters out anomalies based on a criterion related to the total cost over a period of 15 days. Currently, a minimum cost threshold of $100 is set.
When the metadata from the cloud services is retrieved and the relevant entity's cost column aggregated, CCM performs a binary check. This check involves comparing the total cost incurred over a period of 15 days to the set minimum cost threshold of $100. It is considered for further analysis only if it exceeds $100.
View Cost Anomalies
You can view cost anomalies for the following:
- Clusters: Kubernetes Clusters, Namespaces, and Workloads
- AWS: Service and Account
- GCP: Products, Projects, and SKUs
- Azure: Subscription ID, Service Name, and Resources
Perform the following steps to view cost anomalies:
- In Cloud Costs, click Anomalies. The Anomalies page is displayed.
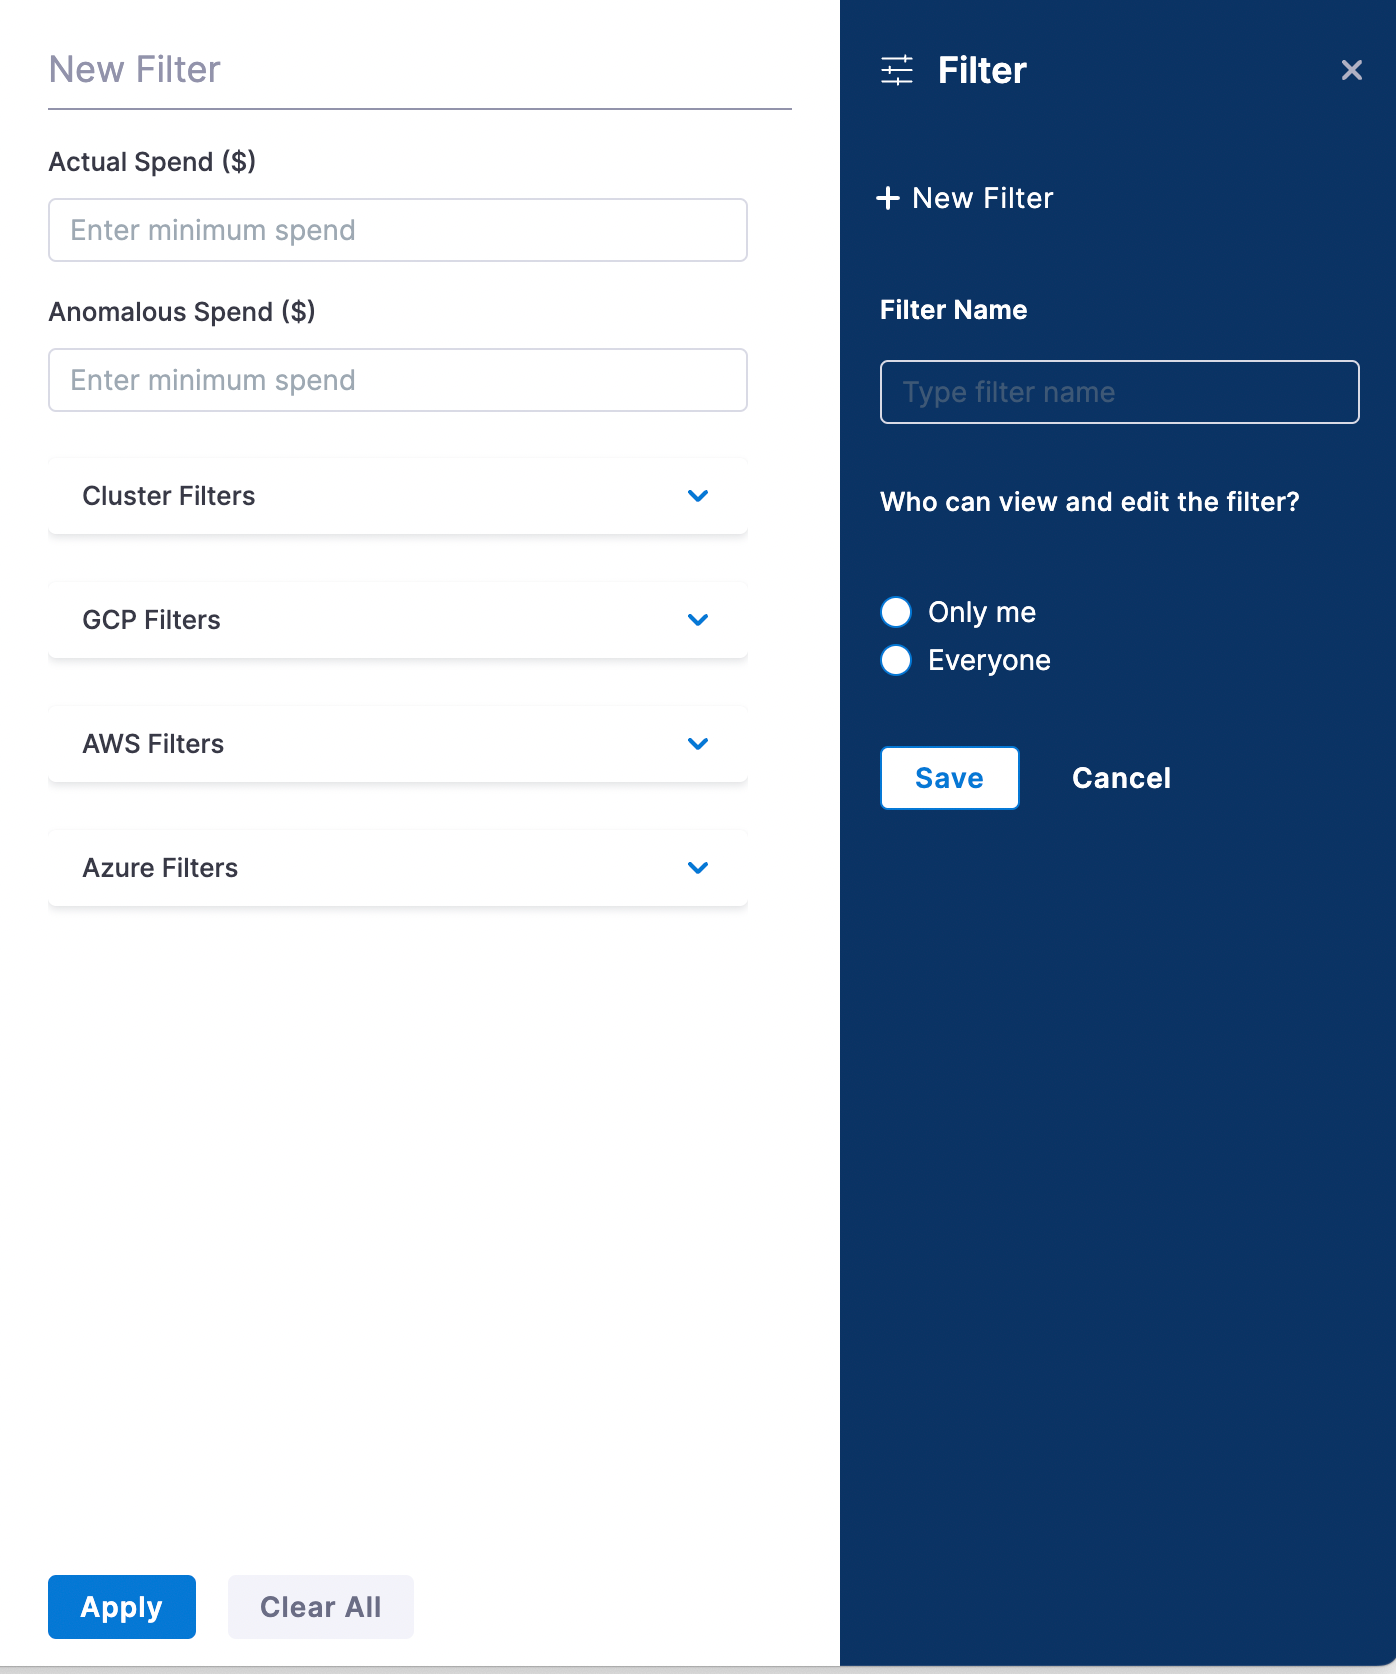
(Optional) You can create a filter to view details for the selected resources and spend amount. To create a filter:- Click the filter icon.
- Enter a filter name and click Save.
- To filter based on the spend amount, enter the minimum amount in the Actual Spend and Anomalous Spend fields.
- Select the required cloud resources and/or clusters from the drop-down.
- Click Apply.

The Anomalies page displays the following information based on the selected filter:
| Anomalies Detected | The total number of anomalies detected across all of your cloud providers during the specified time period. |
| Total Cost Impact | The total cost impact because of the anomalous spend across all the resources in your cloud infrastructure. |
| Top 3 Anomalies | Top 3 anomalies across all resources. Hover on the resource to view the detail of the resource. |
| Anomalies by Cloud Providers | The number of anomalies by the cloud providers. For example, GCP, AWS. |
| Date | The date on which the anomaly was detected. |
| Anomalous Spend | The total amount of anomalous spend per resource. |
| Variance | The percentage variation between the actual spend and the predicted spend. |
| Resource | Detail of the resource on which the anomalous cost was detected. |
-
From the Resource, click the anomaly for which you want to view the details.
-
Click the more actions menu (three-dot) and then click This is false anomaly to determine if this is a false anomalous event. This feature helps CCM cost anomaly detection models to learn and improve the algorithm to be more tailored to your assessments.

Create an anomaly alert for your Perspective
You can create alerts to receive notifications when an anomaly is detected. To create an alert, perform the following steps:
-
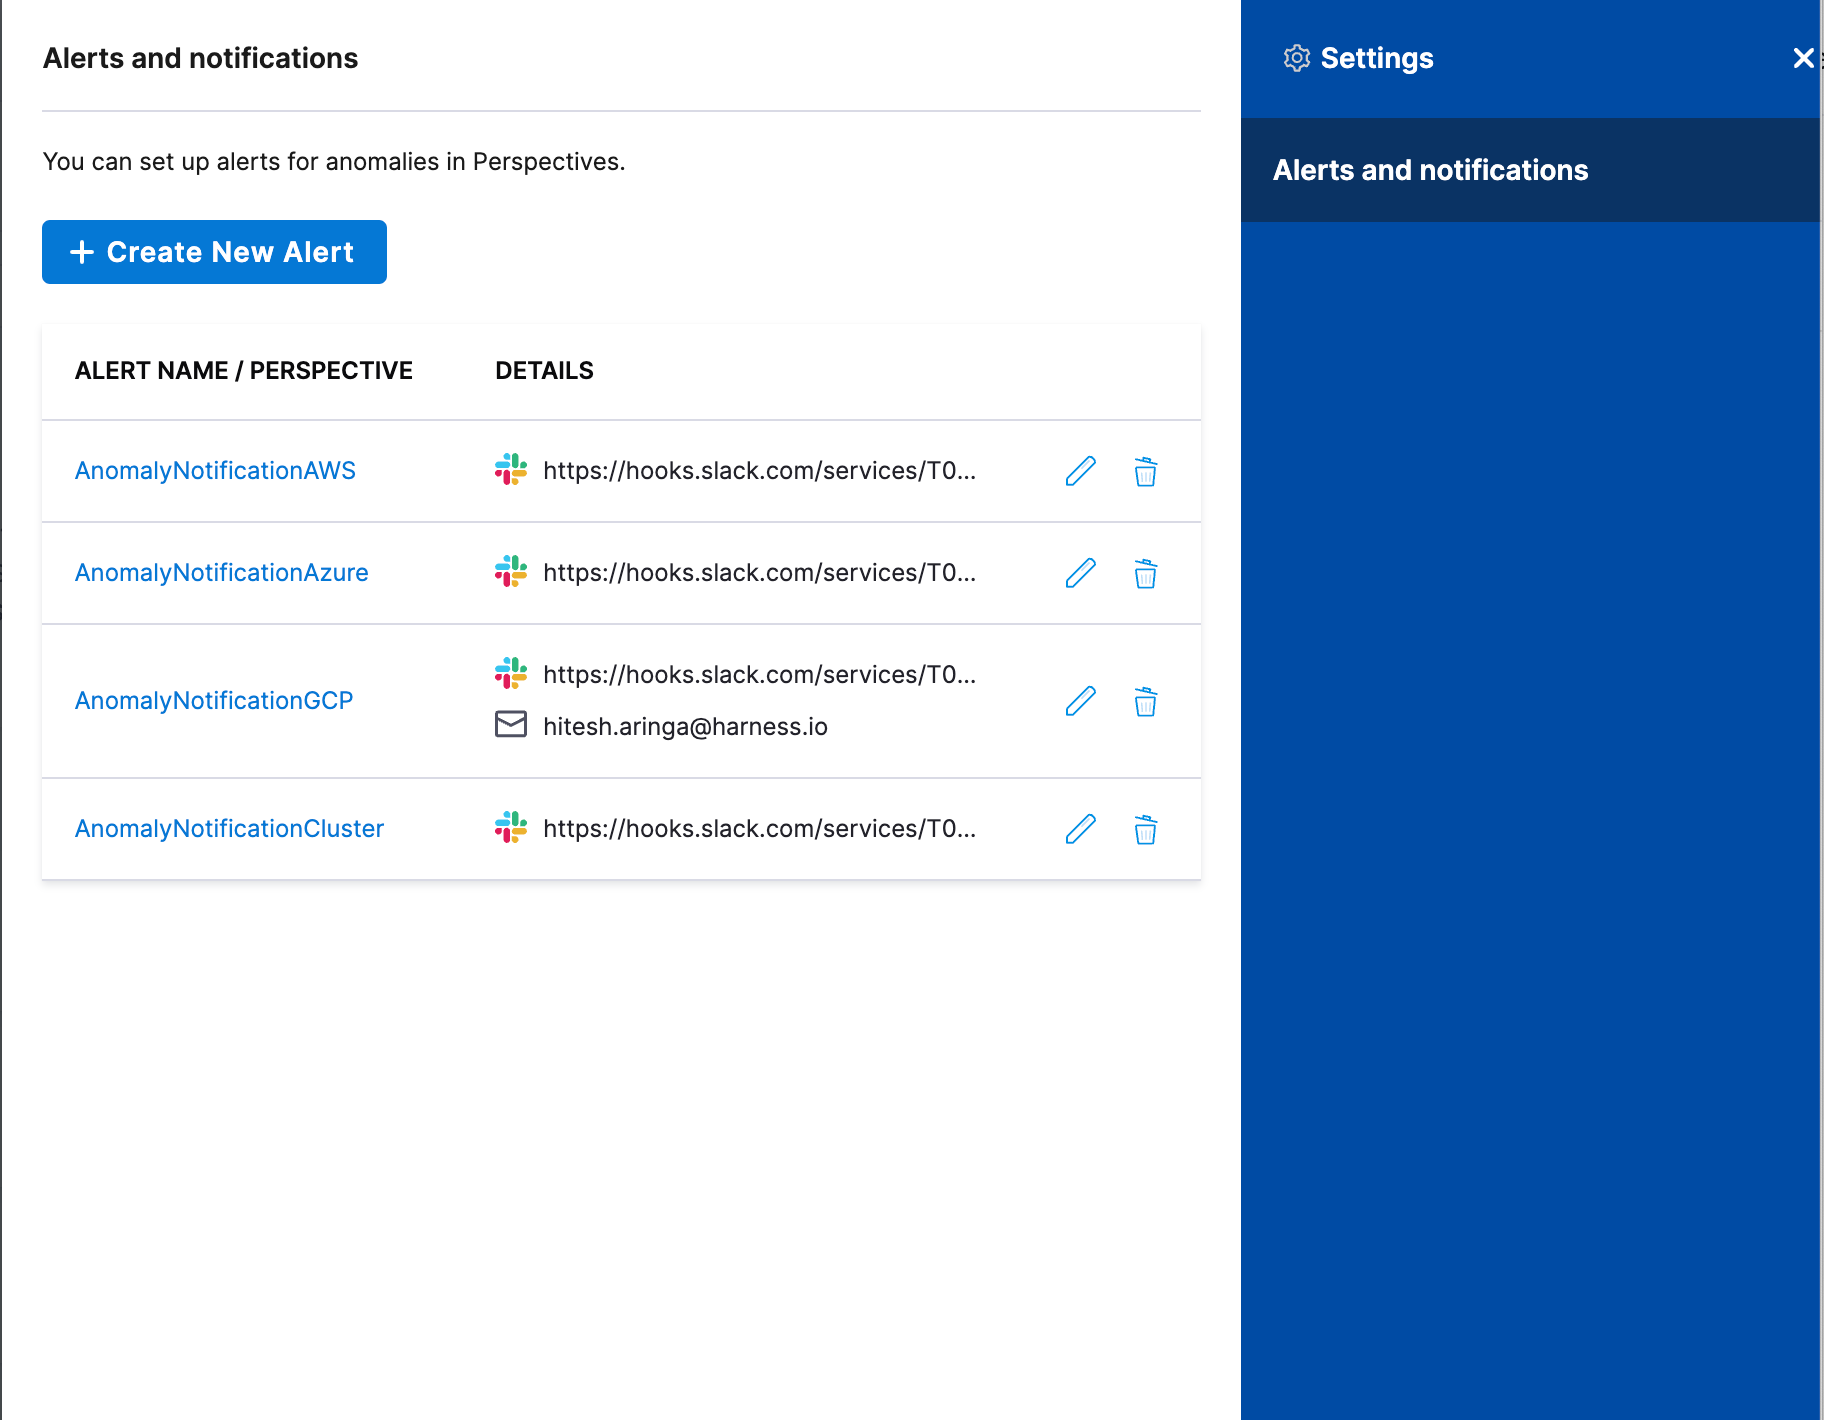
On the Anomalies page, click Settings.
-
In Alerts and notifications, click Create New Alert.

-
Select the Perspective for which you want to create an alert.
-
Click add channel to add anomaly alert channels.
-
Select Slack Webhook URL or Email and enter the details to receive notifications. To learn how to create a Slack webhook URL, see Send Notifications Using Slack.
-
Click Save and Continue.
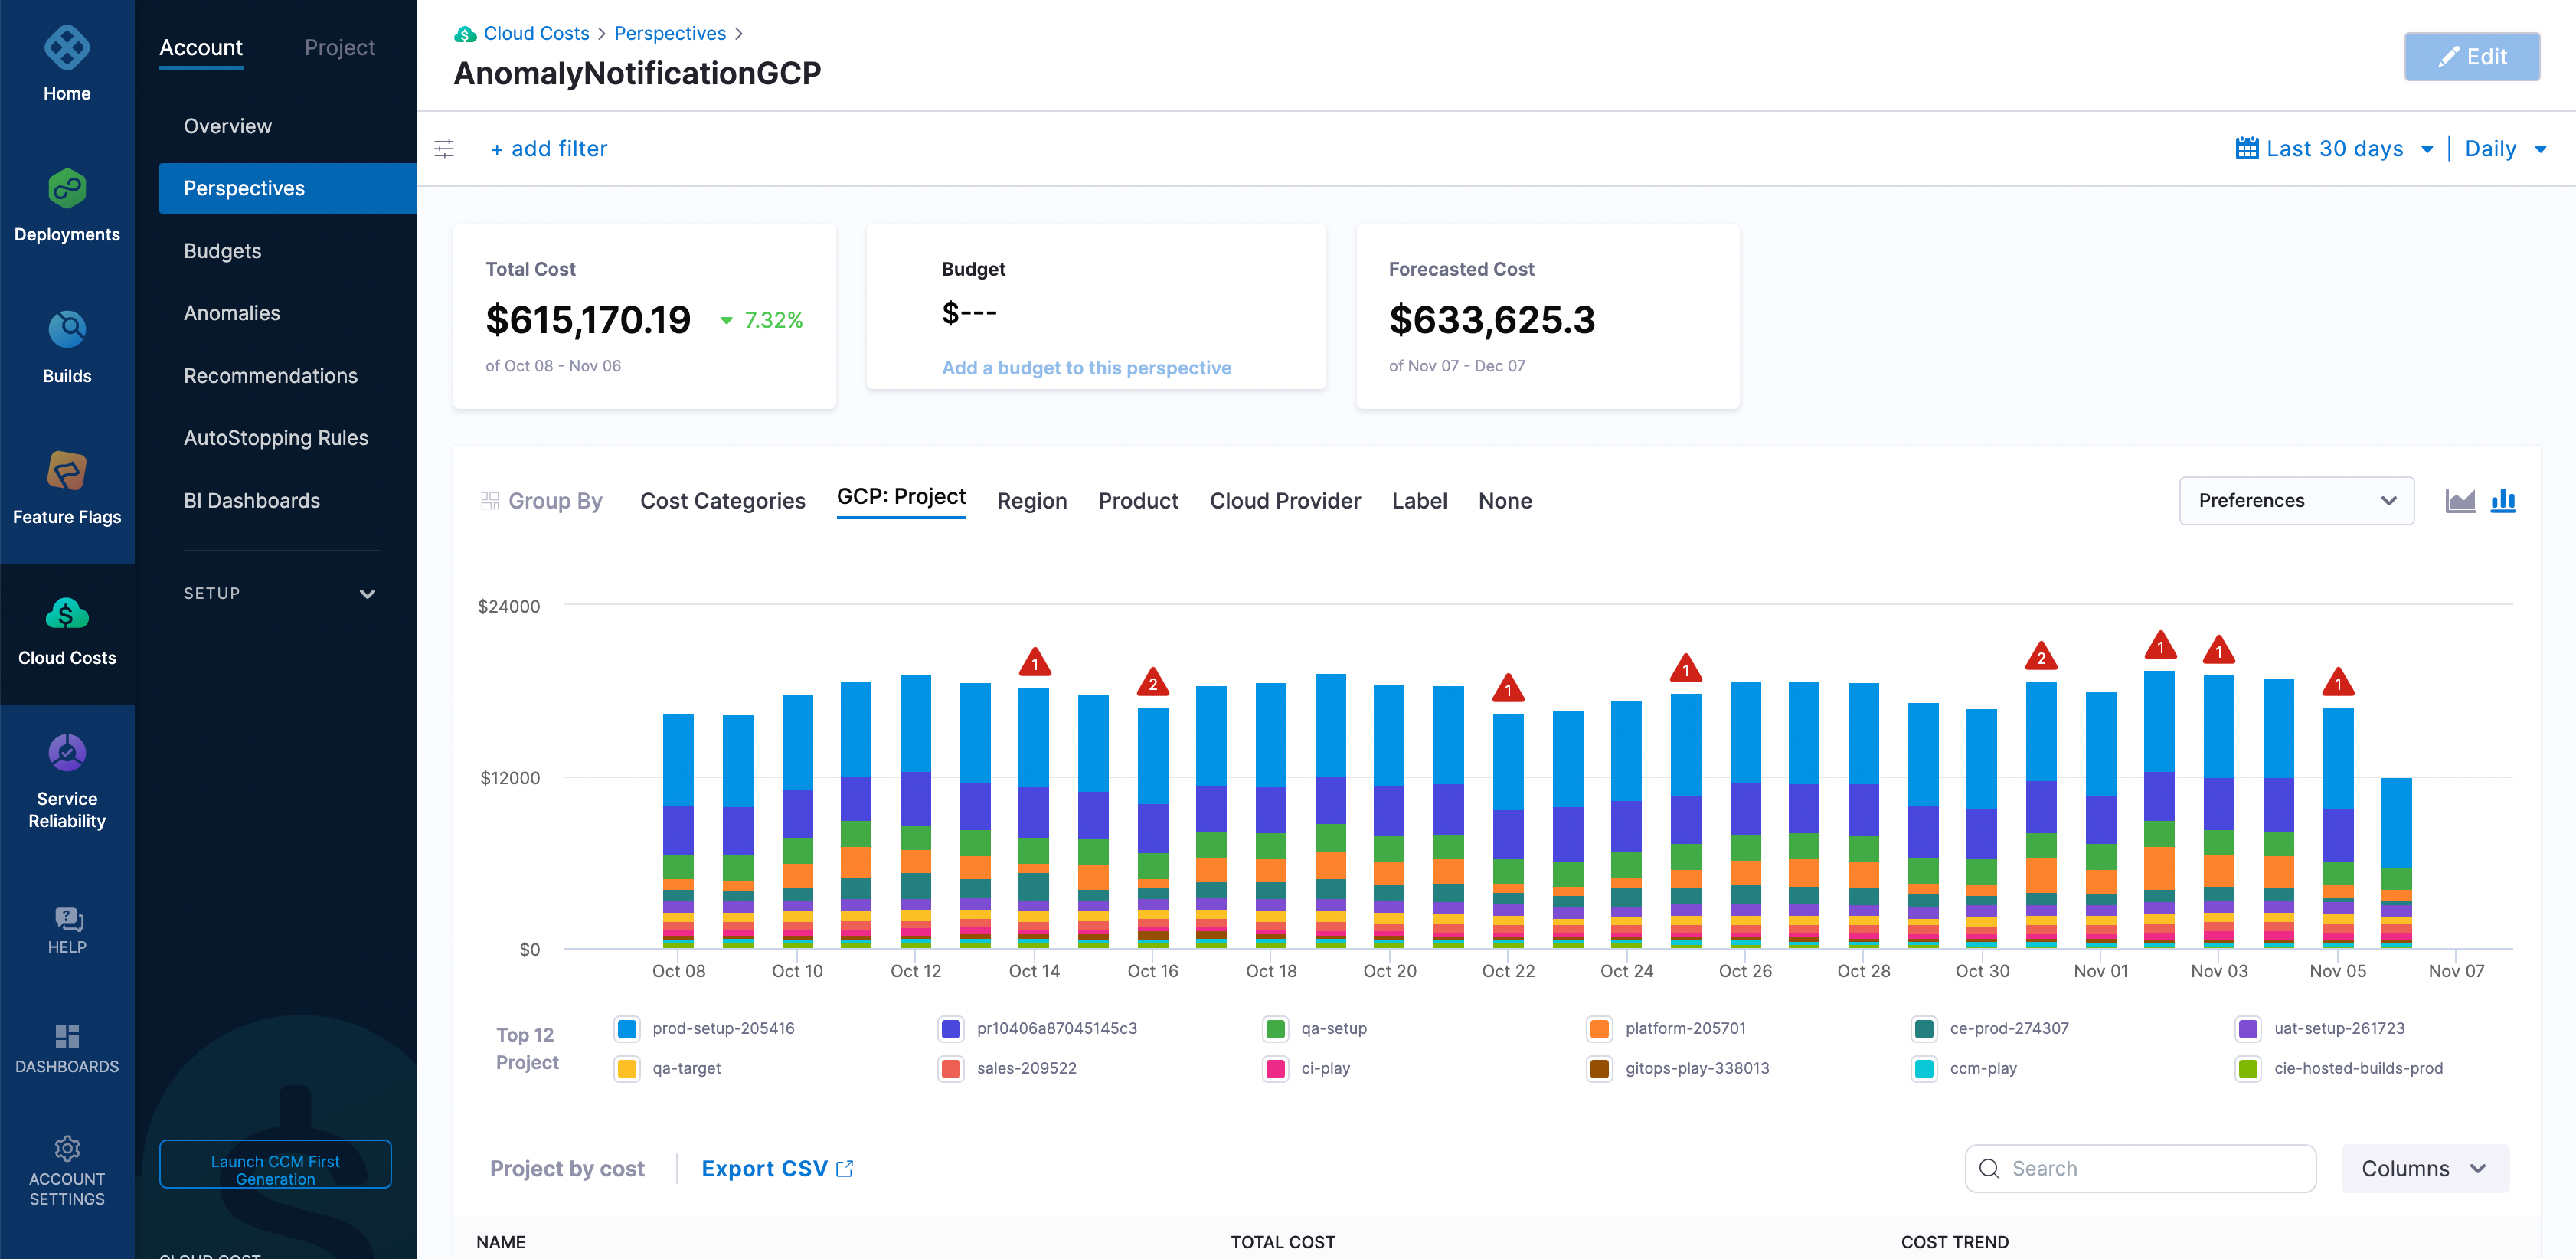
An anomaly alert is created. Click the alert to view the anomalies on the Perspectives page.
-
Hover over the number of anomalies on the graph to apply anomaly filters and view anomalies as shown below:

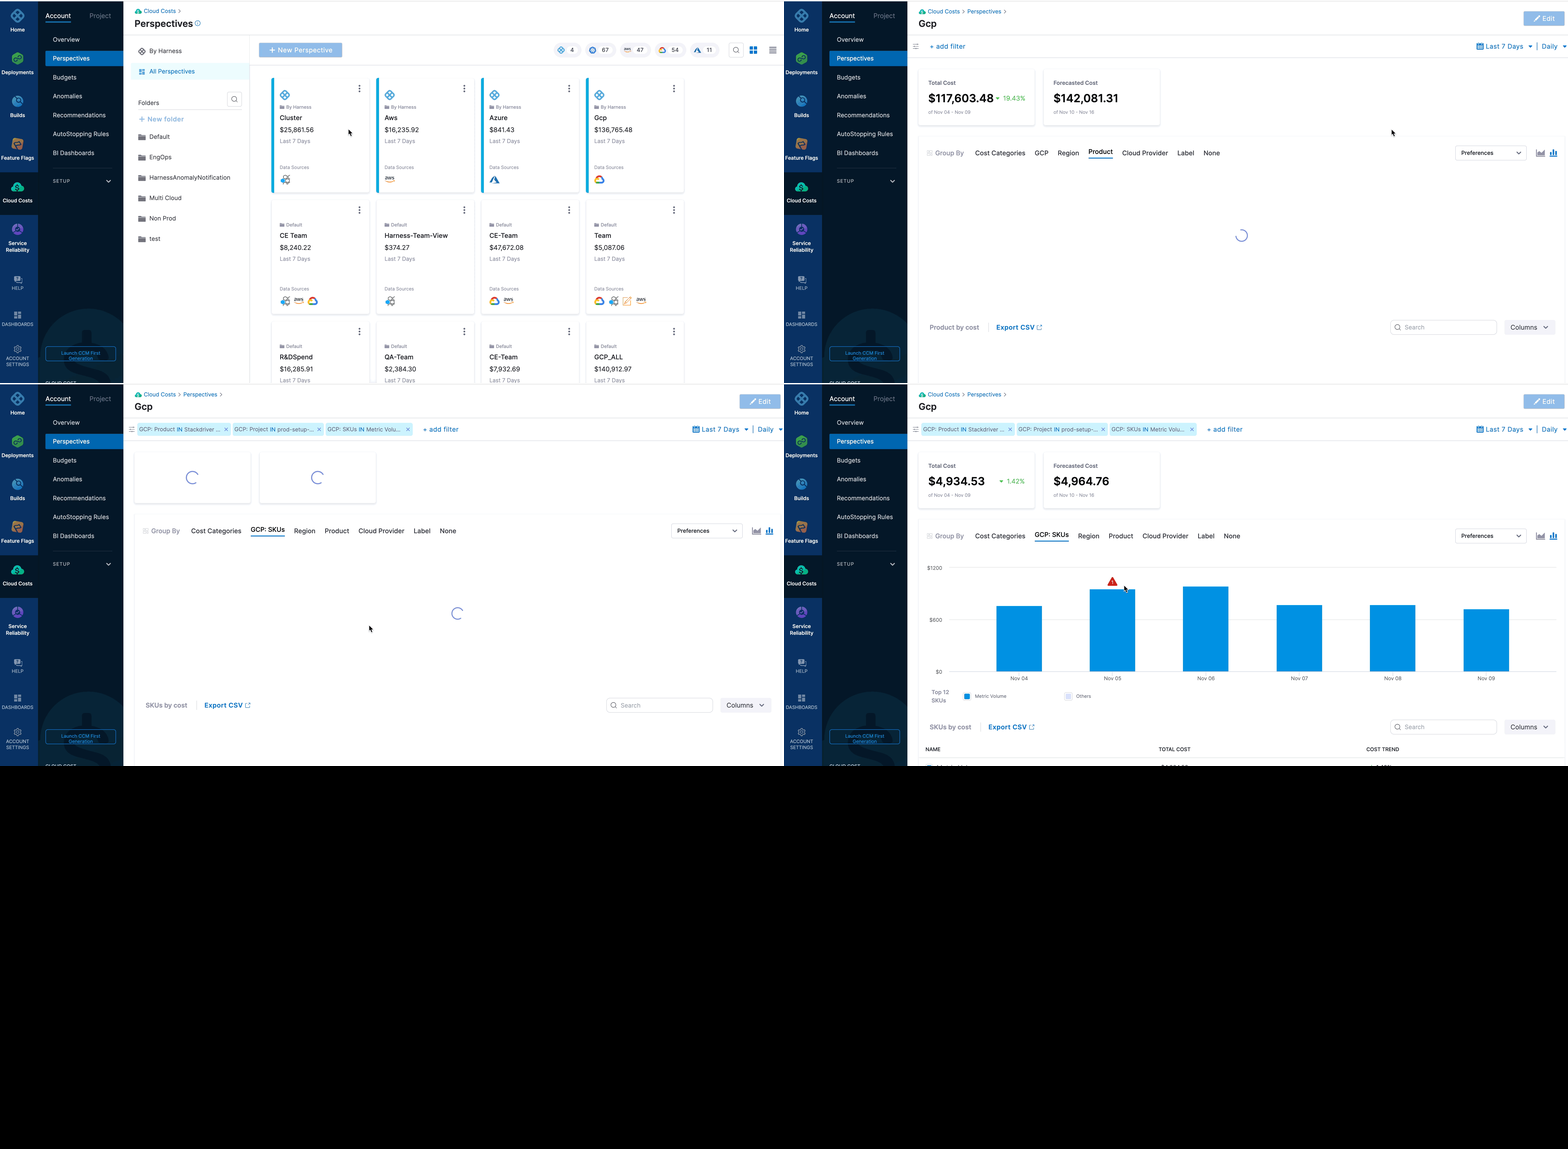
For example, when you click the GCP perspective, it displays the data for the entire GCP ecosystem. There are multiple anomalies in the given example. Hovering over the graph displays two links:
- View anomalies: Clicking this option takes you to the Anomalies page filtered to that day.
- Apply anomaly filters: Clicking this option applies the set of filters and takes you to the resource that caused the anomaly. This is useful in identifying the root cause for further analysis. The Apply anomaly filters link is disabled if there are multiple anomalies on a given day.
Access to perspectives and the associated anomalies depends on the role assignment. For more information, go to Manage access control for CCM Perspective folders.